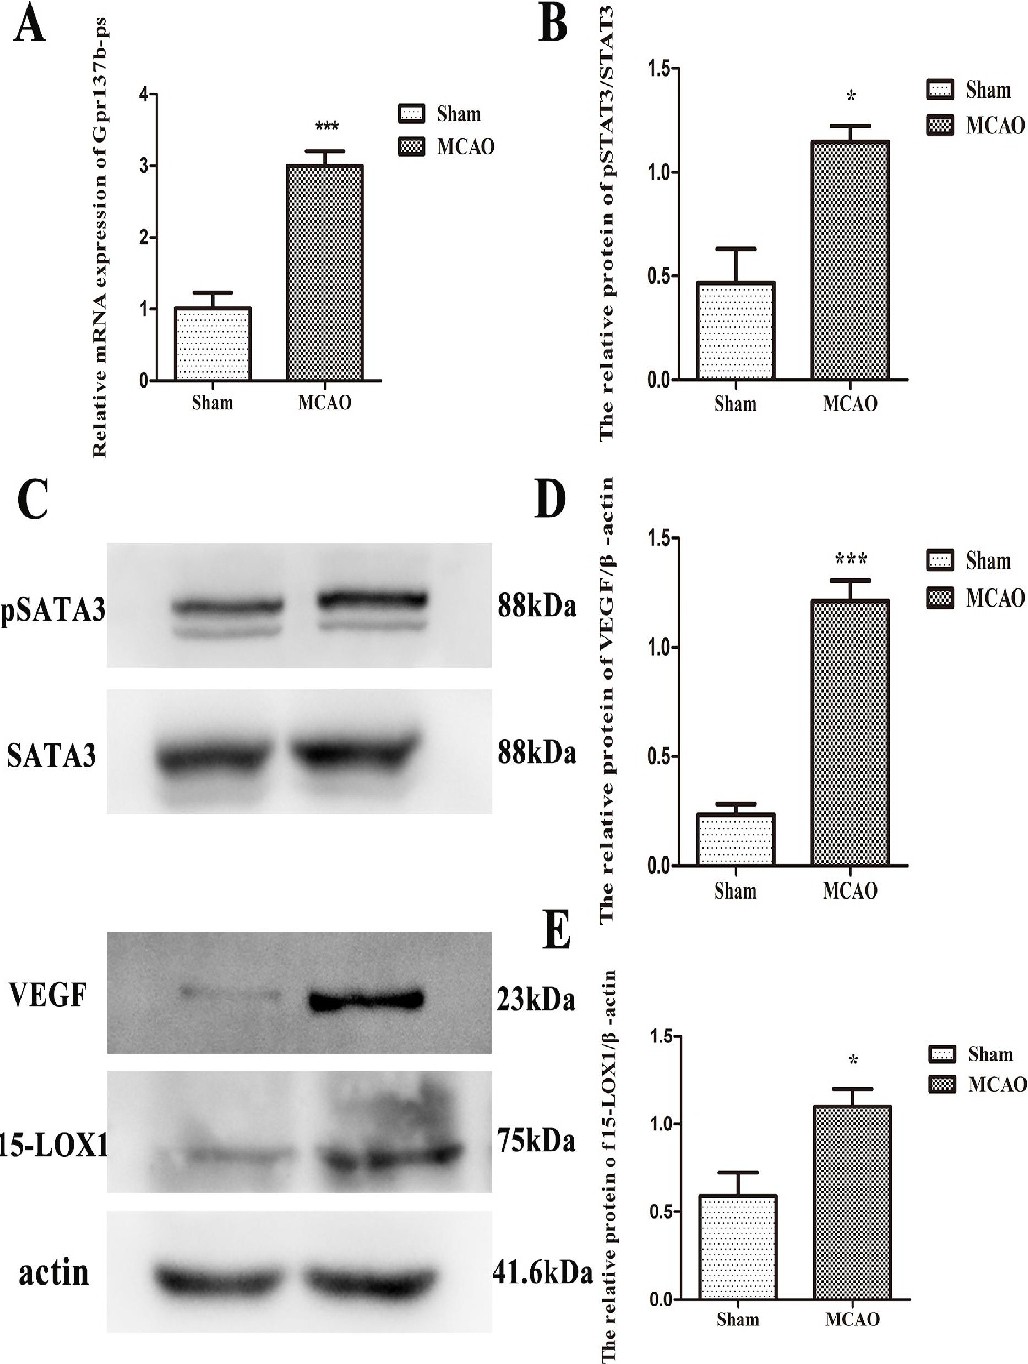
Fig. 9. The validation of Gpr137b-ps, VEGF, pSTAT3 and 15-LOX1 in vivo. (A) The relative mRNA expression of Gpr137b-ps after MCAO. (B-E) The protein levels of VEGF, pSTAT3 and 15-LOX1 in the sham and MCAO groups (* p <0.05, ** p <0.01, *** p <0.001 vs control). All results are presented as the mean ± SEM.